Katelyn_Polar_Plots_2.0.mw

Katelyn Sayles 


Loading plots  

`assign`(p1, implicitplot(`+`(`*`(`^`(x, 2)), `*`(`^`(y, 2))) = 1, x = -5 .. 5, y = -5 .. 5, scaling = constrained, numpoints = 5000, color = magenta)) 

PLOT(CURVES(Array(1..95, 1..2, {(1, 1) = -.915492958, (1, 2) = -.39694835633777775, (2, 1) = -.8674882626120833, (2, 2) = -.492957747, (3, 1) = -.774647888, (3, 2) = -.6322183087945313, (4, 1) = -.773... (1)
 

`assign`(p2, implicitplot(`+`(`*`(`^`(`+`(x, `-`(2)), 2)), `*`(`^`(`+`(y, `-`(2.75)), 2))) = 1, x = -20 .. 20, y = -20 .. 20, scaling = constrained, numpoints = 8000, color = magenta))
 

PLOT(CURVES(Array(1..31, 1..2, {(1, 1) = 1.1235955, (1, 2) = 2.318192526848257, (2, 1) = 1.3517592517435064, (2, 2) = 2.02247191, (3, 1) = 1.57303371, (3, 2) = 1.8710392418371313, (4, 1) = 1.765302153... (2)
 

`assign`(p3, implicitplot(`+`(`*`(`^`(`+`(x, `-`(1)), 2)), `*`(`^`(`+`(y, `-`(1.5)), 2))) = 1, x = -20 .. 20, y = -20 .. 20, scaling = constrained, numpoints = 8000, color = magenta))
 

PLOT(CURVES(Array(1..31, 1..2, {(1, 1) = .2247191, (1, 2) = .9096135681020177, (2, 1) = .4817989038004999, (2, 2) = .6741573, (3, 1) = .6741573, (3, 2) = .573349156341331, (4, 1) = .7857024062077657, ... (3)
 

`assign`(p4, implicitplot(`+`(`*`(`^`(`+`(x, `-`(1.5)), 2)), `*`(`^`(y, 2))) = 1, x = -20 .. 20, y = -20 .. 20, scaling = constrained, numpoints = 8000, color = magenta))
 

PLOT(CURVES(Array(1..31, 1..2, {(1, 1) = .6741573, (1, 2) = -.522296339736328, (2, 1) = .7876982121932046, (2, 2) = -.67415731, (3, 1) = 1.1235955, (3, 2) = -.8987886215244141, (4, 1) = 1.393828664248... (4)
 

`assign`(p5, implicitplot(`+`(`*`(`^`(x, 2)), `*`(`^`(`+`(y, 1), 2))) = 1, x = -20 .. 20, y = -20 .. 20, scaling = constrained, numpoints = 8000, color = magenta))
 

PLOT(CURVES(Array(1..29, 1..2, {(1, 1) = -.67415731, (1, 2) = -1.7091311864709382, (2, 1) = -.3624501686316344, (2, 2) = -1.884740844432882, (3, 1) = -.2247191, (3, 2) = -1.9623358130529656, (4, 1) = ... (5)
 

`assign`(p6, implicitplot(`+`(`*`(`^`(`+`(x, 1), 2)), `*`(`^`(`+`(y, 2), 2))) = 1, x = -20 .. 20, y = -20 .. 20, scaling = constrained, numpoints = 8000, color = magenta))
 

PLOT(CURVES(Array(1..31, 1..2, {(1, 1) = -1.57303371, (1, 2) = -2.794128304138918, (2, 1) = -1.3185936801040588, (2, 2) = -2.92134832, (3, 1) = -1.12359551, (3, 2) = -2.9806124700711267, (4, 1) = -1.0... (6)
 

`assign`(p7, implicitplot(`+`(`*`(`^`(`+`(x, `-`(2.5)), 2)), `*`(`^`(`+`(y, `-`(1.5)), 2))) = 1, x = -20 .. 20, y = -20 .. 20, scaling = constrained, numpoints = 8000, color = magenta))
 

PLOT(CURVES(Array(1..33, 1..2, {(1, 1) = 1.57303371, (1, 2) = 1.126716599485597, (2, 1) = 1.5737078674976002, (2, 2) = 1.1235955, (3, 1) = 1.5777153595370375, (3, 2) = 1.1189138504629625, (4, 1) = 1.9... (7)
 

`assign`(p8, implicitplot(`+`(`*`(`^`(`+`(x, 1.45), 2)), `*`(`^`(`+`(y, .35), 2))) = 1, x = -20 .. 20, y = -20 .. 20, scaling = constrained, numpoints = 8000, color = magenta))
 

PLOT(CURVES(Array(1..31, 1..2, {(1, 1) = -2.02247191, (1, 2) = -1.1605707773302014, (2, 1) = -1.9657317977087532, (2, 2) = -1.180335622291247, (3, 1) = -1.57303371, (3, 2) = -1.31712803433693, (4, 1) ... (8)
 

`assign`(p9, implicitplot(`+`(`*`(`^`(`+`(x, `-`(.75)), 2)), `*`(`^`(`+`(y, 1.5), 2))) = 1, x = -20 .. 20, y = -20 .. 20, scaling = constrained, numpoints = 8000, color = magenta))
 

PLOT(CURVES(Array(1..33, 1..2, {(1, 1) = -.2247191, (1, 2) = -1.6479091633984515, (2, 1) = -0.7601628623742784e-1, (2, 2) = -2.02247191, (3, 1) = .2247191, (3, 2) = -2.324337880895542, (4, 1) = .59158... (9)
 

`assign`(p10, implicitplot(`+`(`*`(`^`(`+`(x, `-`(.5)), 2)), `*`(`^`(`+`(y, `-`(2.5)), 2))) = 1, x = -20 .. 20, y = -20 .. 20, scaling = constrained, numpoints = 8000, color = magenta))
 

PLOT(CURVES(Array(1..31, 1..2, {(1, 1) = -.2247191, (1, 2) = 1.84678651540544, (2, 1) = .15976517670117413, (2, 2) = 1.57303371, (3, 1) = .2247191, (3, 2) = 1.5448342018787626, (4, 1) = .2542134828659... (10)
 

`assign`(p11, implicitplot(`+`(`*`(`^`(`+`(x, 2), 2)), `*`(`^`(`+`(y, .90), 2))) = 1, x = -20 .. 20, y = -20 .. 20, scaling = constrained, numpoints = 8000, color = magenta))
 

PLOT(CURVES(Array(1..31, 1..2, {(1, 1) = -2.92134832, (1, 2) = -1.2363760427836823, (2, 1) = -2.704692820156237, (2, 2) = -1.57303371, (3, 1) = -2.47191011, (3, 2) = -1.7536661010495047, (4, 1) = -2.2... (11)
 

`assign`(p12, implicitplot(`+`(`*`(`^`(`+`(x, 2), 2)), `*`(`^`(`+`(y, 2.75), 2))) = 1, x = -20 .. 20, y = -20 .. 20, scaling = constrained, numpoints = 8000, color = magenta))
 

PLOT(CURVES(Array(1..31, 1..2, {(1, 1) = -2.92134832, (1, 2) = -3.0750557701941554, (2, 1) = -2.7532110777365295, (2, 2) = -3.37078652, (3, 1) = -2.47191011, (3, 2) = -3.6025560880521184, (4, 1) = -2.... (12)
 

`assign`(p13, implicitplot(`+`(`*`(`^`(`+`(x, .75), 2)), `*`(`^`(`+`(y, `-`(1.25)), 2))) = 1, x = -20 .. 20, y = -20 .. 20, scaling = constrained, numpoints = 8000, color = magenta))
 

PLOT(CURVES(Array(1..31, 1..2, {(1, 1) = -1.57303371, (1, 2) = .6869438272224001, (2, 1) = -1.5655298794152395, (2, 2) = .6741573, (3, 1) = -1.12359551, (3, 2) = .3438695072496153, (4, 1) = -.71785403... (13)
 

`assign`(p14, implicitplot(`+`(`*`(`^`(`+`(x, .25), 2)), `*`(`^`(`+`(y, 3), 2))) = 1, x = -20 .. 20, y = -20 .. 20, scaling = constrained, numpoints = 8000, color = magenta))
 

PLOT(CURVES(Array(1..33, 1..2, {(1, 1) = -1.12359551, (1, 2) = -3.454201552669322, (2, 1) = -.7876781460205955, (2, 2) = -3.82022472, (3, 1) = -.67415731, (3, 2) = -3.8907174978196175, (4, 1) = -.5870... (14)
 

`assign`(p15, implicitplot(`+`(`*`(`^`(`+`(x, 1.25), 2)), `*`(`^`(`+`(y, `-`(2.5)), 2))) = 1, x = -20 .. 20, y = -20 .. 20, scaling = constrained, numpoints = 8000, color = magenta))
 

PLOT(CURVES(Array(1..31, 1..2, {(1, 1) = -2.02247191, (1, 2) = 1.89769101089672, (2, 1) = -1.6062446025258383, (2, 2) = 1.57303371, (3, 1) = -1.57303371, (3, 2) = 1.5572382855007287, (4, 1) = -1.55576... (15)
 

`assign`(p16, implicitplot(`+`(`*`(`^`(`+`(x, 1.25), 2)), `*`(`^`(`+`(y, 3.85), 2))) = 1, x = -20 .. 20, y = -20 .. 20, scaling = constrained, numpoints = 8000, color = magenta))
 

PLOT(CURVES(Array(1..31, 1..2, {(1, 1) = -2.02247191, (1, 2) = -4.445932720385901, (2, 1) = -1.7011137905351947, (2, 2) = -4.71910113, (3, 1) = -1.57303371, (3, 2) = -4.783239845022833, (4, 1) = -1.50... (16)
 

`assign`(p17, implicitplot(`+`(`*`(`^`(`+`(x, 2), 2)), `*`(`^`(`+`(y, `-`(1)), 2))) = 1, x = -20 .. 20, y = -20 .. 20, scaling = constrained, numpoints = 8000, color = magenta))
 

PLOT(CURVES(Array(1..31, 1..2, {(1, 1) = -2.92134832, (1, 2) = .633340984656393, (2, 1) = -2.5984052169953173, (2, 2) = .2247191, (3, 1) = -2.47191011, (3, 2) = .13659891291251108, (4, 1) = -2.3548549... (17)
 

`assign`(p18, plot(`+`(`*`(2, `*`(sin(`+`(x, `-`(1))))), 3.3), x = 1 .. 1.5, scaling = constrained, color = brown)) 

PLOT(CURVES([[1., 3.30000000000000], [1.00262880251256, 3.30525759896959], [1.00491610952261, 3.30983217944088], [1.00748842547739, 3.31497671098023], [1.01007779241206, 3.32015524365260], [1.01265485... (18)
 

`assign`(p19, plot(`+`(`*`(2, `*`(sin(x))), 3.3), x = 0 .. 1.5, scaling = constrained, color = brown)) 

PLOT(CURVES([[0., 3.30000000000000], [0.788640753768844e-2, 3.31577265157640], [0.147483285678392e-1, 3.32949558782862], [0.224652764321608e-1, 3.34492677363638], [0.302333772361809e-1, 3.360457543215... (19)
 

`assign`(points, [[1.5, 4.25], [1.5, 5.3]]) 

[[1.5, 4.25], [1.5, 5.3]] (20)
 

`assign`(p20, plot(points, style = line, color = brown)) 

PLOT(CURVES([[1.50000000000000, 4.25000000000000], [1.50000000000000, 5.30000000000000]]), STYLE(LINE), COLOUR(RGB, .64705882, .16470588, .16470588), AXESLABELS( (21)
 

`assign`(p21, plot([`+`(`*`(5, `*`(cos(theta))), `*`(cos(theta), `*`(sin(`+`(`*`(3, `*`(theta)))))), 10), `+`(`*`(5, `*`(sin(theta))), `*`(sin(theta), `*`(sin(`+`(`*`(3, `*`(theta)))))), `-`(5)), thet...
 

PLOT(CURVES([[15., -5.], [15.0961594453871, -4.83158962157667], [15.1743841154743, -4.67993140521029], [15.2552177641517, -4.50400685181592], [15.3278383793575, -4.32164538768821], [15.3903005931926, ... (22)
 

`assign`(p22, plot([`+`(`*`(5, `*`(cos(`+`(`*`(4, `*`(theta)))), `*`(cos(theta)))), 10), `+`(`*`(5, `*`(cos(`+`(`*`(4, `*`(theta)))), `*`(sin(theta)))), `-`(1)), theta = `*`(`+`(`*`(7, `*`(Pi))), `/`(...
 

PLOT(CURVES([[9.99999999798722, -.999999999166278], [9.61575725647102, -.850058361629810], [9.27856158742572, -.733307155435705], [8.89890214041757, -.618060407254851], [8.51919489699436, -.5198573163... (23)
 

`assign`(p23, implicitplot(`+`(`*`(`^`(x, 2)), `*`(`^`(`+`(y, `-`(10)), 2))) = 10, x = -20 .. 20, y = -20 .. 20, scaling = constrained, numpoints = 5000, color = yellow))
 

PLOT(CURVES(Array(1..79, 1..2, {(1, 1) = -3.09859155, (1, 2) = 9.410798126166668, (2, 1) = -3.0813380286362495, (2, 2) = 9.29577465, (3, 1) = -3.072047671029585, (3, 2) = 9.269230771029585, (4, 1) = -... (24)
 

`assign`(p24, implicitplot(`+`(`*`(`^`(x, 2)), `*`(`^`(`+`(y, `-`(10)), 2))) = 8, x = -20 .. 20, y = -20 .. 20, scaling = constrained, numpoints = 5000, color = yellow))
 

PLOT(CURVES(Array(1..69, 1..2, {(1, 1) = -2.53521127, (1, 2) = 8.749698194257144, (2, 1) = -2.5276408469210936, (2, 2) = 8.73239437, (3, 1) = -2.5109859152659997, (3, 2) = 8.708169014835999, (4, 1) = ... (25)
 

`assign`(p25, plot(`+`(x, 10), x = -2 .. 2, color = yellow)) 

PLOT(CURVES([[-2., 8.], [-1.97896957989950, 8.02103042010050], [-1.96067112381910, 8.03932887618090], [-1.94009259618090, 8.05990740381910], [-1.91937766070352, 8.08062233929648], [-1.89876117969849, ... (26)
 

`assign`(p26, plot(`+`(`-`(x), 10), x = -2 .. 2, color = yellow)) 

PLOT(CURVES([[-2., 12.], [-1.97896957989950, 11.9789695798995], [-1.96067112381910, 11.9606711238191], [-1.94009259618090, 11.9400925961809], [-1.91937766070352, 11.9193776607035], [-1.89876117969849,... (27)
 

`assign`(points, [[0, 12.8], [0, 7.2]]) 

[[0, 12.8], [0, 7.2]] (28)
 

`assign`(p27, plot(points, style = line, color = yellow)) 

PLOT(CURVES([[0., 12.8000000000000], [0., 7.20000000000000]]), STYLE(LINE), COLOUR(RGB, 1.00000000, 1.00000000, 0.), AXESLABELS( (29)
 

`assign`(points, [[2.85, 10], [-2.85, 10]]) 

[[2.85, 10], [-2.85, 10]] (30)
 

`assign`(p28, plot(points, style = line, color = yellow)) 

PLOT(CURVES([[2.85000000000000, 10.], [-2.85000000000000, 10.]]), STYLE(LINE), COLOUR(RGB, 1.00000000, 1.00000000, 0.), AXESLABELS( (31)
 

`assign`(p29, plot([`+`(`*`(3, `*`(cos(theta))), `-`(`*`(6, `*`(sin(theta), `*`(cos(theta))))), `-`(10)), `+`(`*`(3, `*`(sin(theta))), `-`(`*`(`+`(`*`(6, `*`(sin(theta)))), sin(theta))), 2), theta = 0...
 

PLOT(CURVES([[-7., 2.], [-7.19969964104793, 2.09254020565958], [-7.37544645011389, 2.16234534350672], [-7.57455975319800, 2.22891567918459], [-7.77577425262019, 2.28319436272759], [-7.97600191711288, ... (32)
 

`assign`(p30, plot([`+`(`*`(3, `*`(cos(theta))), `-`(`*`(6, `*`(sin(theta), `*`(cos(theta))))), `-`(10)), `+`(`*`(3, `*`(sin(theta))), `-`(`*`(`+`(`*`(6, `*`(sin(theta)))), sin(theta))), 2), theta = 0...
 

PLOT(CURVES([[-7., 2.], [-7.09949471618767, 2.04791273780013], [-7.18664616436925, 2.08692884886967], [-7.28521062992612, 2.12782834566603], [-7.38492134560894, 2.16581011142079], [-7.48454686185560, ... (33)
 

`assign`(p31, plot(sin(`+`(x, 5)), x = -14.8 .. -22, color = brown)) 

PLOT(CURVES([[-22., .961397491879557], [-21.9621452438191, .950294987675767], [-21.9292080228744, .939526383416790], [-21.8921666731256, .926199020829738], [-21.8548797892663, .911500040736711], [-21.... (34)


`assign`(p32, plot(`+`(sin(`+`(x, 5)), 1), x = -14.4 .. -22, color = brown)) 

PLOT(CURVES([[-22., 1.96139749187956], [-21.9600422018090, 1.94963810248052], [-21.9252751352563, 1.93817219907535], [-21.8861759327437, 1.92392369556378], [-21.8468175553367, 1.90815445656838], [-21.... (35)
 

`assign`(p33, implicitplot(`+`(`*`(`^`(`+`(x, 22.5), 2)), `*`(`^`(`+`(y, `-`(1.5)), 2))) = .5, x = -30 .. 10, y = -10 .. 10, scaling = constrained, numpoints = 10000, color = brown))
 

PLOT(CURVES(Array(1..32, 1..2, {(1, 1) = -23.2, (1, 2) = 1.3999999999999975, (2, 1) = -23.12, (2, 2) = 1.2, (3, 1) = -23.06666666666667, (3, 2) = 1.1333333333333337, (4, 1) = -22.96, (4, 2) = 1.0, (5,... (36)
 

`assign`(points, [[-10, 2], [-10, 4]]) 

[[-10, 2], [-10, 4]] (37)
 

`assign`(p34, plot(points, style = line, color = brown)) 

PLOT(CURVES([[-10., 2.], [-10., 4.]]), STYLE(LINE), COLOUR(RGB, .64705882, .16470588, .16470588), AXESLABELS( (38)
 

`assign`(p35, implicitplot(`+`(`*`(`^`(`+`(x, `-`(6)), 2), `*`(`/`(0.5e-1))), `*`(`^`(`+`(y, 3), 2), `*`(`/`(.15)))) = 1, x = -10 .. 10, y = -10 .. 10, scaling = constrained, numpoints = 10000))
 

PLOT(CURVES(Array(1..19, 1..2, {(1, 1) = 5.8, (1, 2) = -3.149999999992499, (2, 1) = 5.816666666670001, (2, 2) = -3.2, (3, 1) = 6.0, (3, 2) = -3.3833333333208335, (4, 1) = 6.091666666662708, (4, 2) = -... (39)
 

`assign`(p36, implicitplot(`+`(`*`(`^`(`+`(x, `-`(8)), 2), `*`(`/`(0.5e-1))), `*`(`^`(`+`(y, 4), 2), `*`(`/`(.15)))) = 1, x = -10 .. 10, y = -10 .. 10, scaling = constrained, numpoints = 10000))
 

PLOT(CURVES(Array(1..19, 1..2, {(1, 1) = 7.8, (1, 2) = -4.149999999992499, (2, 1) = 7.816666666670001, (2, 2) = -4.2, (3, 1) = 8.0, (3, 2) = -4.3833333333208335, (4, 1) = 8.091666666662707, (4, 2) = -... (40)
 

`assign`(p37, implicitplot(`+`(`*`(`^`(`+`(x, `-`(6.5)), 2), `*`(`/`(0.5e-1))), `*`(`^`(`+`(y, 5), 2), `*`(`/`(.15)))) = 1, x = -10 .. 10, y = -10 .. 10, scaling = constrained, numpoints = 10000))
 

PLOT(CURVES(Array(1..19, 1..2, {(1, 1) = 6.4, (1, 2) = -5.333333333323333, (2, 1) = 6.533333333323333, (2, 2) = -5.333333333323333, (3, 1) = 6.6, (3, 2) = -5.333333333323333, (4, 1) = 6.64444444444259... (41)
 

`assign`(p38, implicitplot(`+`(`*`(`^`(`+`(x, `-`(7.5)), 2), `*`(`/`(0.5e-1))), `*`(`^`(`+`(y, 6), 2), `*`(`/`(.15)))) = 1, x = -10 .. 10, y = -10 .. 10, scaling = constrained, numpoints = 10000))
 

PLOT(CURVES(Array(1..19, 1..2, {(1, 1) = 7.4, (1, 2) = -6.333333333323334, (2, 1) = 7.533333333323334, (2, 2) = -6.333333333323334, (3, 1) = 7.6, (3, 2) = -6.333333333323334, (4, 1) = 7.64444444444259... (42)
 

`assign`(p39, implicitplot(`+`(`*`(`^`(`+`(x, `-`(8)), 2), `*`(`/`(0.5e-1))), `*`(`^`(`+`(y, 2), 2), `*`(`/`(.15)))) = 1, x = -10 .. 10, y = -10 .. 10, scaling = constrained, numpoints = 10000))
 

PLOT(CURVES(Array(1..19, 1..2, {(1, 1) = 7.8, (1, 2) = -2.149999999992499, (2, 1) = 7.816666666670001, (2, 2) = -2.2, (3, 1) = 8.0, (3, 2) = -2.383333333320833, (4, 1) = 8.091666666662707, (4, 2) = -2... (43)
 

`assign`(p40, implicitplot(`+`(`*`(`^`(`+`(x, `-`(9)), 2), `*`(`/`(0.5e-1))), `*`(`^`(`+`(y, 7), 2), `*`(`/`(.15)))) = 1, x = -10 .. 10, y = -10 .. 10, scaling = constrained, numpoints = 10000))
 

PLOT(CURVES(Array(1..19, 1..2, {(1, 1) = 8.8, (1, 2) = -7.149999999992505, (2, 1) = 8.816666666669999, (2, 2) = -7.199999999999999, (3, 1) = 9.0, (3, 2) = -7.3833333333208335, (4, 1) = 9.0916666666627... (44)
 

`assign`(p41, implicitplot(`+`(`*`(`^`(`+`(x, `-`(8.5)), 2), `*`(`/`(0.5e-1))), `*`(`^`(`+`(y, 9), 2), `*`(`/`(.15)))) = 1, x = -10 .. 10, y = -10 .. 10, scaling = constrained, numpoints = 10000))
 

PLOT(CURVES(Array(1..19, 1..2, {(1, 1) = 8.4, (1, 2) = -9.333333333323335, (2, 1) = 8.533333333323334, (2, 2) = -9.333333333323335, (3, 1) = 8.6, (3, 2) = -9.333333333323335, (4, 1) = 8.64444444444259... (45)
 

`assign`(p42, implicitplot(`+`(`*`(`^`(`+`(x, `-`(8)), 2), `*`(`/`(0.5e-1))), `*`(`^`(`+`(y, 8), 2), `*`(`/`(.15)))) = 1, x = -10 .. 10, y = -10 .. 10, scaling = constrained, numpoints = 70000))
 

PLOT(CURVES(Array(1..55, 1..2, {(1, 1) = 7.81132075, (1, 2) = -8.205463824658771, (2, 1) = 7.840664308394477, (2, 2) = -8.264150943, (3, 1) = 7.88679245, (3, 2) = -8.333343157123819, (4, 1) = 7.895165... (46)
 

`assign`(p43, implicitplot(`+`(`*`(`^`(`+`(x, `-`(10)), 2), `*`(`/`(0.5e-1))), `*`(`^`(`+`(y, 7), 2), `*`(`/`(.15)))) = 1, x = -20 .. 20, y = -20 .. 20, scaling = constrained, numpoints = 70000))
 

PLOT(CURVES(Array(1..29, 1..2, {(1, 1) = 9.88679245, (1, 2) = -7.331693618851238, (2, 1) = 9.902106907859977, (2, 2) = -7.336069178874562, (3, 1) = 10.03773584, (3, 2) = -7.374820307964728, (4, 1) = 1... (47)
 

`assign`(p44, implicitplot(`+`(`*`(`^`(`+`(x, `-`(11)), 2), `*`(`/`(0.5e-1))), `*`(`^`(`+`(y, 2), 2), `*`(`/`(.15)))) = 1, x = -20 .. 20, y = -20 .. 20, scaling = constrained, numpoints = 70000))
 

PLOT(CURVES(Array(1..29, 1..2, {(1, 1) = 10.79245282, (1, 2) = -2.123191766349576, (2, 1) = 10.811163528907008, (2, 2) = -2.18867925, (3, 1) = 10.848584932914129, (3, 2) = -2.2448113591953764, (4, 1) ... (48)
 

`assign`(p45, implicitplot(`+`(`*`(`^`(`+`(x, `-`(12)), 2), `*`(`/`(0.5e-1))), `*`(`^`(`+`(y, 3), 2), `*`(`/`(.15)))) = 1, x = -20 .. 20, y = -20 .. 20, scaling = constrained, numpoints = 70000))
 

PLOT(CURVES(Array(1..29, 1..2, {(1, 1) = 11.8490566, (1, 2) = -3.2787735795230493, (2, 1) = 11.962924499080948, (2, 2) = -3.359150926624698, (3, 1) = 11.99999999, (3, 2) = -3.3853218635315607, (4, 1) ... (49)
 

`assign`(p46, implicitplot(`+`(`*`(`^`(`+`(x, `-`(11)), 2), `*`(`/`(0.5e-1))), `*`(`^`(`+`(y, 4), 2), `*`(`/`(.15)))) = 1, x = -20 .. 20, y = -20 .. 20, scaling = constrained, numpoints = 70000))
 

PLOT(CURVES(Array(1..29, 1..2, {(1, 1) = 10.79245282, (1, 2) = -4.137617837024364, (2, 1) = 10.794991022375587, (2, 2) = -4.1509434, (3, 1) = 10.798375291911155, (3, 2) = -4.1568658719111555, (4, 1) =... (50)
 

`assign`(p47, implicitplot(`+`(`*`(`^`(`+`(x, `-`(13)), 2), `*`(`/`(0.5e-1))), `*`(`^`(`+`(y, 3), 2), `*`(`/`(.15)))) = 1, x = -20 .. 20, y = -20 .. 20, scaling = constrained, numpoints = 70000))
 

PLOT(CURVES(Array(1..29, 1..2, {(1, 1) = 12.90566037, (1, 2) = -3.3437014356789705, (2, 1) = 13.025168453365877, (2, 2) = -3.364791103365876, (3, 1) = 13.05660377, (3, 2) = -3.370338513739923, (4, 1) ... (51)
 

`assign`(p48, implicitplot(`+`(`*`(`^`(`+`(x, `-`(10)), 2), `*`(`/`(0.5e-1))), `*`(`^`(`+`(y, 10), 2), `*`(`/`(.15)))) = 1, x = -20 .. 20, y = -20 .. 20, scaling = constrained, numpoints = 70000))
 

PLOT(CURVES(Array(1..27, 1..2, {(1, 1) = 9.88679245, (1, 2) = -10.332446088469672, (2, 1) = 9.903537734369223, (2, 2) = -10.33962264, (3, 1) = 10.03773584, (3, 2) = -10.376222129083164, (4, 1) = 10.05... (52)
 

`assign`(p49, implicitplot(`+`(`*`(`^`(`+`(x, `-`(10)), 2), `*`(`/`(0.5e-1))), `*`(`^`(`+`(y, 9), 2), `*`(`/`(.15)))) = 1, x = -20 .. 20, y = -20 .. 20, scaling = constrained, numpoints = 70000))
 

PLOT(CURVES(Array(1..29, 1..2, {(1, 1) = 9.88679245, (1, 2) = -9.326886789715905, (2, 1) = 9.95090710001655, (2, 2) = -9.347133524264148, (3, 1) = 10.03773584, (3, 2) = -9.374553130378342, (4, 1) = 10... (53)
 

`assign`(p50, implicitplot(`+`(`*`(`^`(`+`(x, `-`(11.5)), 2), `*`(`/`(0.5e-1))), `*`(`^`(`+`(y, 8), 2), `*`(`/`(.15)))) = 1, x = -20 .. 20, y = -20 .. 20, scaling = constrained, numpoints = 70000))
 

PLOT(CURVES(Array(1..31, 1..2, {(1, 1) = 11.39622641, (1, 2) = -8.33643867446877, (2, 1) = 11.54171907219008, (2, 2) = -8.37735849, (3, 1) = 11.54716981, (3, 2) = -8.378380503452156, (4, 1) = 11.54773... (54)
 

`assign`(p51, implicitplot(`+`(`*`(`^`(`+`(x, `-`(12)), 2), `*`(`/`(0.5e-1))), `*`(`^`(`+`(y, 6), 2), `*`(`/`(.15)))) = 1, x = -20 .. 20, y = -20 .. 20, scaling = constrained, numpoints = 70000))
 

PLOT(CURVES(Array(1..29, 1..2, {(1, 1) = 11.8490566, (1, 2) = -6.281629975286044, (2, 1) = 11.901493684344779, (2, 2) = -6.316588034344779, (3, 1) = 11.99999999, (3, 2) = -6.382258910095826, (4, 1) = ... (55)
 

`assign`(p52, implicitplot(`+`(`*`(`^`(`+`(x, `-`(12.5)), 2), `*`(`/`(0.5e-1))), `*`(`^`(`+`(y, 5), 2), `*`(`/`(.15)))) = 1, x = -20 .. 20, y = -20 .. 20, scaling = constrained, numpoints = 70000))
 

PLOT(CURVES(Array(1..29, 1..2, {(1, 1) = 12.30188679, (1, 2) = -5.166576809279606, (2, 1) = 12.316594098677482, (2, 2) = -5.20754717, (3, 1) = 12.365618466936889, (3, 2) = -5.2712788511591135, (4, 1) ... (56)
 

`assign`(p53, implicitplot(`+`(`*`(`^`(`+`(x, `-`(14)), 2), `*`(`/`(0.5e-1))), `*`(`^`(`+`(y, 4), 2), `*`(`/`(.15)))) = 1, x = -20 .. 20, y = -20 .. 20, scaling = constrained, numpoints = 70000))
 

PLOT(CURVES(Array(1..29, 1..2, {(1, 1) = 13.81132075, (1, 2) = -4.196029862547314, (2, 1) = 13.881892038521755, (2, 2) = -4.3018868, (3, 1) = 13.96226414, (3, 2) = -4.374221695480033, (4, 1) = 14.0179... (57)
 

`assign`(p54, implicitplot(`+`(`*`(`^`(`+`(x, `-`(14.5)), 2), `*`(`/`(0.5e-1))), `*`(`^`(`+`(y, 2), 2), `*`(`/`(.15)))) = 1, x = -20 .. 20, y = -20 .. 20, scaling = constrained, numpoints = 70000))
 

PLOT(CURVES(Array(1..29, 1..2, {(1, 1) = 14.41509433, (1, 2) = -2.355317317984004, (2, 1) = 14.431937400065408, (2, 2) = -2.3564657100654065, (3, 1) = 14.56603773, (3, 2) = -2.365608921867787, (4, 1) ... (58)


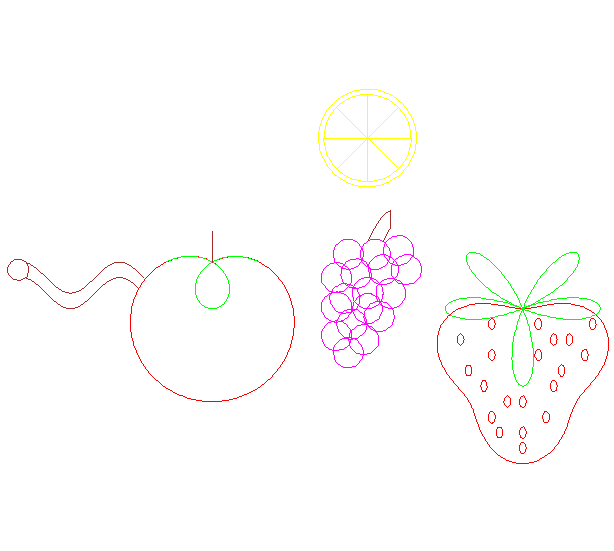
display(p1, p2, p3, p4, p5, p6, p7, p8, p9, p10, p11, p12, p13, p14, p15, p16, p17, p18, p19, p20, p21, p22, p23, p24, p25, p26, p27, p28, p29, p30, p31, p32, p33, p34, p35, p36, p37, p38, p39, p40, p...
 

Plot_2d
 

Katelyn Sayles 

5/4/11 

Multivariable Calculus Polar Plots Project 


I have abided by the Wheaton College Honor Code in this work.